


Kigali — Every litre of fuel sold in Rwanda has already traveled thousands of miles before reaching a pump.
It has crossed oceans, passed through global trading hubs, moved across congested East African ports, and endured long overland journeys. By the time it arrives in Rwanda—a country with no oil reserves, no refinery, and no pipeline—it reflects not just energy demand, but the weight of a complex global system.
Understanding Rwanda’s petroleum supply is therefore less about where fuel is bought, and more about how it moves—through a layered network shaped by geography, infrastructure, and geopolitics far beyond its borders.
As of April 17, 2026, the Rwanda Utilities Regulatory Authority (RURA) increased the maximum retail price of petrol to Rwf 2,938 per litre, up from Rwf 2,303, citing severe volatility in global oil markets.
Diesel, however, remained capped at Rwf 2,205 per litre, with the government intervening to shield transport and logistics from sharper cost increases.
KT Press has taken the decision to unpack the wider politics and structure of Rwanda’s oil system because public debate often stops at the surface explanation—global conflict, including the Iran-related tensions, or “international price hikes.”
While these factors are real, they do not fully explain why prices in Rwanda move the way they do, or why increases sometimes feel sudden and uneven.
The reality is more layered. Fuel prices in Rwanda are shaped not only by global shocks, but also by shipping routes, regional bottlenecks, trading structures, and domestic policy decisions on subsidies and pricing caps.
For many consumers, the result is confusion: prices rise sharply, but the reasons appear distant or overly simplified.
KT Press aims to close that gap by demonstrating how global markets, regional logistics, and local policy decisions combine to determine what ultimately appears on the pump.
A Country Without Oil
Rwanda’s position in the global energy system is defined by what it lacks.
Unlike neighboring Uganda, which holds commercially viable crude reserves, Rwanda produces no oil and has no refining capacity. World Bank data shows that in 2022, the country imported just $593 million worth of petroleum products—effectively none.
Instead, Rwanda imports only refined petroleum products: petrol, diesel, and jet fuel.
This places the country at the very end of the oil value chain. Extraction and refining—the stages where value and pricing power are concentrated—take place elsewhere. Rwanda enters only at the final stage, where it is fully exposed to global price movements.
When international oil prices rise, domestic prices follow, typically with a short delay.
How Much Fuel Rwanda Uses
Demand is modest by global standards but substantial for a landlocked economy.
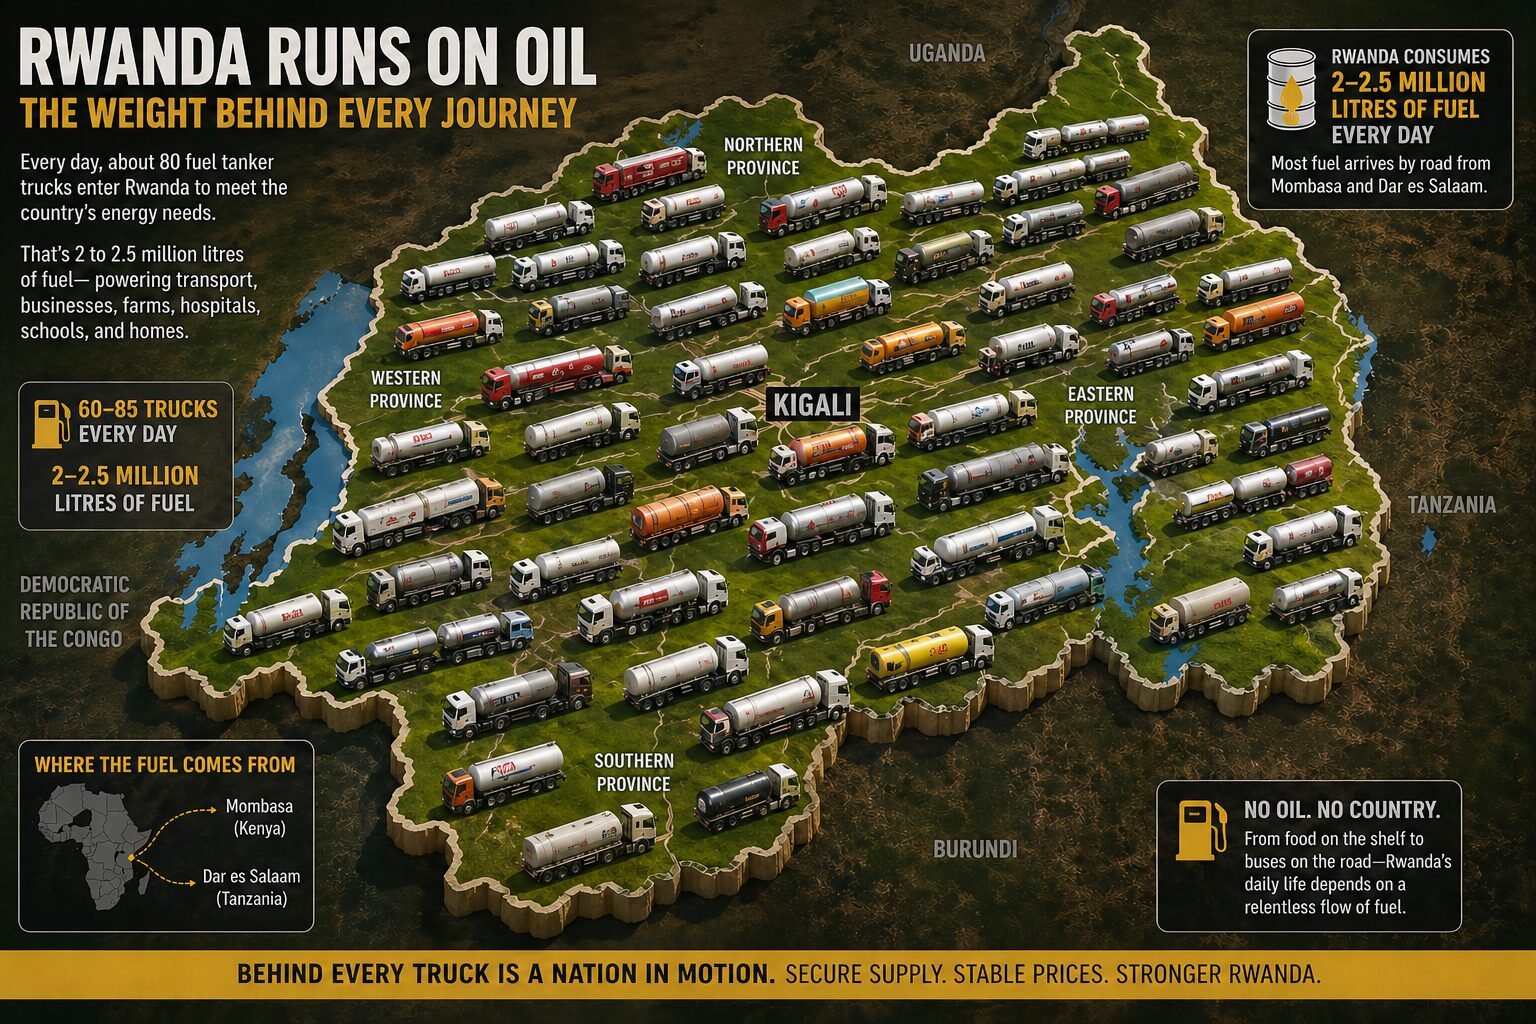
According to the Ministry of Trade and Industry, as of March 2026, normal daily consumption was 2 to 2.5 million litres, while peak consumption was 3.1 million litres.
The surge—roughly 40 percent above normal—was driven by pre-emptive buying ahead of price adjustments and cross-border demand from regional motorists.
On an annual basis, this translates to approximately 730 million to 912 million litres.
All of it is imported.
Rwanda also acts as what is termed as “secondary distribution hub” for petroleum products consumed in eastern DR Congo. Rwanda sends oil products to DRC as re-exports, and they cover a huge chuck of the total volume.
It means that should Kigali ever wake one morning and impose an oil blockade on eastern DRC, life there will collapse in days. There is no other supply route, because of no roads.
Where the Fuel Really Comes From
Although fuel physically enters Rwanda through East Africa, its origins lie much farther away.
Most refined products are sourced from the Middle East, particularly Saudi Arabia, the United Arab Emirates, and Oman, alongside refining hubs in India and Singapore.
These products are traded through global commodity markets, often handled by firms based in Switzerland, which act as intermediaries—sourcing, financing, and shipping fuel to importing regions like East Africa.
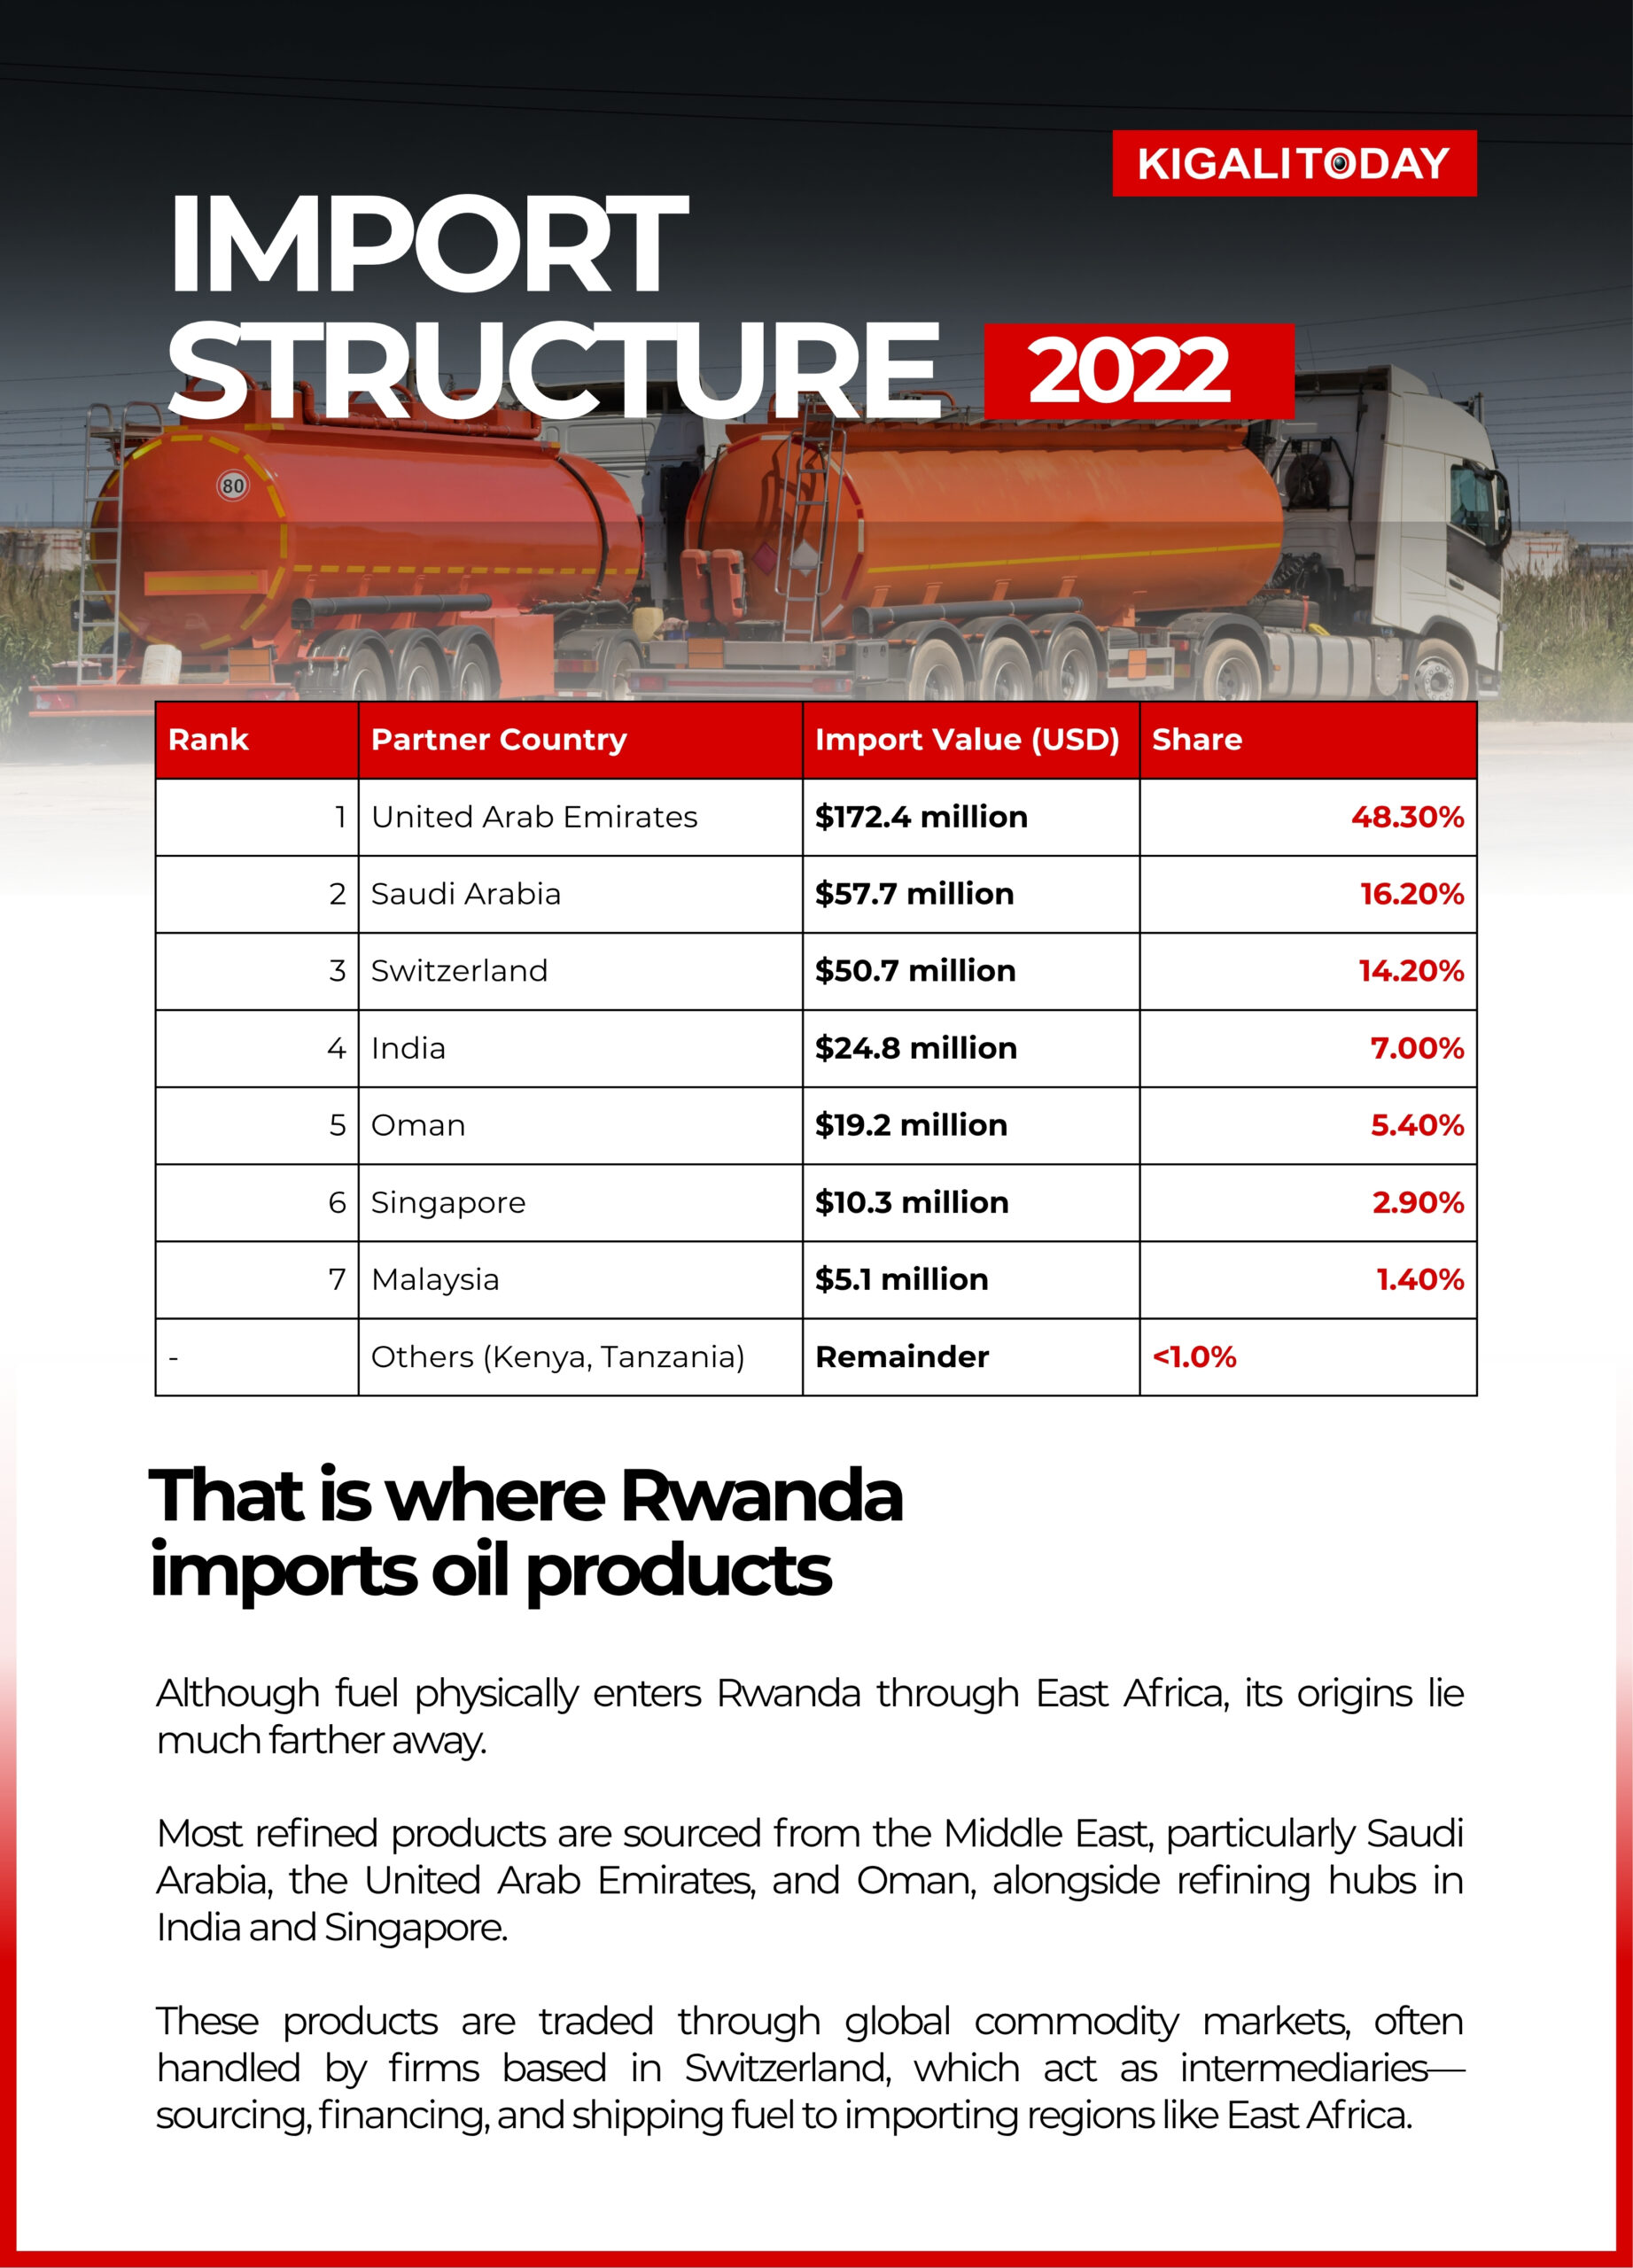
NOTE – These data is based on data from World Bank’s World Integrated Trade Solution (WITS) , UN COMTRADE 2022 figures.
Kenya and Tanzania appear marginally in this data because they function primarily as transit corridors rather than original suppliers.
Two Corridors, One Lifeline
Fuel reaches Rwanda through two main routes: the Central Corridor via Tanzania and the Northern Corridor via Kenya.
Central Corridor: Dar es Salaam Route
Shipments arrive at the Port of Dar es Salaam, then move inland by road through Tanzania to the Rusumo border.
This route has become increasingly dominant due to shorter distances and lower transport costs. But it relies heavily on trucking, leaving it exposed to delays, road conditions, and border inefficiencies.
Northern Corridor: Mombasa Route
The alternative runs through the Port of Mombasa, then across Kenya and Uganda into Rwanda.
It benefits from more developed infrastructure, including pipeline systems within Kenya. Yet congestion, higher costs, and periodic quality concerns have reduced its competitiveness in recent years.
In practice, importers shift between the two routes depending on cost and reliability. The system remains fluid, not fixed.
Trucks and Storage
Within Rwanda, distribution depends entirely on road transport.
Fuel is moved by tanker trucks from border points to storage depots and retail stations. Companies such as Petrocom Ltd operate fleets dedicated to cross-border transport; Petrocom alone runs dozens of trucks.
According to Rwanda Energy Group (REG) data, storage capacity remains limited but critical. National reserves stand at approximately 118 million litres, with a target of 198 million litres.
Key facilities include: Rusororo: 66 million litres and Jabana: 20 million litres
At current consumption levels, this covers 60 days of national demand.
There are plans to expand capacity to 320 million litres, covering at least six months a shift that would significantly strengthen supply security. But even at current levels, it is what nearly all nations have globally.
Storage Breakdown by Product and Location
| Product | Gatsata | Kabuye | Rwabuye | Bigogwe | Jabana | Rusororo | Kanombe | Total (Litres) |
|---|---|---|---|---|---|---|---|---|
| Petrol | 7.2M | 3.1M | 1.9M | 3.0M | 10.0M | 20.0M | – | 45.2M |
| Diesel | 6.7M | 2.7M | 1.9M | 2.0M | 10.0M | 36.0M | – | 59.3M |
| Kerosene | 1.5M | – | – | – | – | – | – | 1.5M |
| Jet A-1 | – | – | – | – | – | 10.0M | 2.0M | 12.0M |
| Total | 15.4M | 5.8M | 3.8M | 5.0M | 20.0M | 66.0M | 2.0M | 118.0M |
The absence of pipelines increases costs and risk. Road transport is slower, more expensive, and more vulnerable to disruption—but currently unavoidable.
What Exactly Rwanda Imports
Rwanda imports a broad mix of petroleum products—not just pump fuel.
| Category | Products |
|---|---|
| Transport Fuels | Petrol, Diesel, Jet A-1, Kerosene |
| Industrial Fuels | Heavy Fuel Oil, Furnace Oil, Marine Fuel, Naphtha |
| Specialized Oils | Transformer Oil, Hydraulic Oil, Turbine Oil, Gear Oil |
| Lubricants | Engine Oil, Greases, Brake Fluid, Industrial Oils |
This diversity reflects a full dependence on imports across transport, industry, and power systems.
Why “Switzerland” Appears in Fuel Imports?
The appearance of Switzerland in Rwanda’s import data often causes confusion. It does not reflect physical oil production, but rather the structure of global commodity trade.
In reality, Switzerland functions as a financial and trading hub for major oil intermediaries such as Vitol, Glencore, Trafigura, and Gunvor. These firms source crude oil—primarily from the Middle East—arrange refining in locations such as India or Gulf states, and then sell the finished products into global markets.
When Rwanda imports fuel, the transaction is recorded against the country where the trading entity is legally registered. That is why “Switzerland” appears in trade statistics.
The same applies to Singapore, another global trading hub with no crude production but significant influence over refined fuel flows.
The key point is structural: Rwanda does not buy directly from oil-producing countries. It buys through intermediaries embedded in global trading systems.
How Fuel Prices Are Set
Fuel pricing in Rwanda is not left to market forces alone. It is managed through a regulated system overseen by the Rwanda Utilities Regulatory Authority (RURA).
The pricing formula follows a structured chain:
- Global benchmark prices based on Singapore’s MOPS index
- Shipping costs from Asia or the Gulf to East African ports
- Inland transport to Rwanda via road corridors
- Distribution margins, taxes, and storage costs
- A formal review cycle every two months
The result is a controlled pricing system that passes global cost changes through a regulated domestic framework rather than allowing free-market volatility.
The Fuel Subsidy Mechanism
Diesel is particularly sensitive because it underpins freight transport, agriculture, and supply chains. Stabilizing its price effectively stabilizes the broader economy.
| Metric | Detail |
|---|---|
| Diesel Price Control | Rwf 2,205/litre maintained |
| Petrol Price Cap | Increase limited (5% vs 6%) |
| Shock Absorption | > Rwf 127/litre avoided |
| Policy Goal | Stabilize inflation and logistics |
| Reserve Context | Up to 2 months |
When fuel prices rise in global markets, the cost does not automatically pass through fully to consumers in Rwanda. The government sometimes steps in to soften the impact. It does this by covering part of the extra cost or limiting how much prices are allowed to increase at the pump.
In practical terms, this means two things:
In 2026, even though global fuel prices were rising, the price of diesel in Rwanda was kept at Rwf 2,205 per litre instead of going higher. This was done to avoid sudden increases that would affect transport costs across the economy.
In 2025, when petrol prices were expected to rise by about 6 percent based on global trends, the actual increase was limited to 5 percent.
Government estimates that without this intervention, consumers would have paid at least Rwf 127 more per litre at one point.
On average, 80 fuel tanker trucks enter Rwanda every day to meet the country’s energy needs. Each truck typically carries between 30,000 and 45,000 litres, delivering the 2 to 2.5 million litres consumed daily.
The reason diesel gets special attention is simple: it is the fuel that keeps the economy moving. Trucks, buses, construction equipment, and farm machinery all depend on it. If diesel becomes expensive quickly, the effects spread fast—food transport costs rise, goods become more expensive in shops, and overall inflation increases.
So by keeping diesel prices more stable, the government is not just managing fuel—it is trying to prevent price shocks from spreading through the entire economy.